Put Your Design System in a Coda.io Doc
I’ve been a fan of user-friendly user-configurable information management web apps for a long time. I love AirTable, I loved (the now defunct) FieldBook even more. I’ve enjoyed the power of Notion.so, Quip, Slab, and Confluence as team wikis and collaborative spaces. I wrote an article a while about about putting your design system in a wiki which was all about creating organization structures and page templates to make your team’s product design system great inside of a wiki - a tool that is simple for non-developers to use.
I am a developer, I do love putting design systems in code repositories like Fractal, Storybook, and UI Engine. But, I think there’s a place in modern product teams for an easy to edit document, bringing together multiple facets of designer’s and developer’s deliverables. I’ve observed teams using big, long Google Sheets to update the status of their design systems, each component getting a row and being updated to show progress in a central place. Well, I of course started thinking about other ways to organize that go beyond a spreadsheet. Project management tools like Trello and Pipefy are good for managing units of work as they move through various states in a process, so that seemed like a good option…
But, then I found Coda. It launched early this year and it’s pretty incredible. It starts with a basic collaborative text document but encourages you to start creating data tables (like Notion and AirTable have). But, the super-power of Coda is the presence of one very important integration, Figma. If you’re designing in Figma, then Coda is the perfect fit.
The Figma integration allows you to copy and paste a URL from the node of a figma document (using the browser not the desktop app) and paste that url into a special formula cell, which formats and displays a nice link with the name of the selected frame, along with a PNG snapshot of the frame as it looks currently. This means you can create a table that describes various components and screens in your application, track their status and see a nice little updated thumbnail right in the same row.
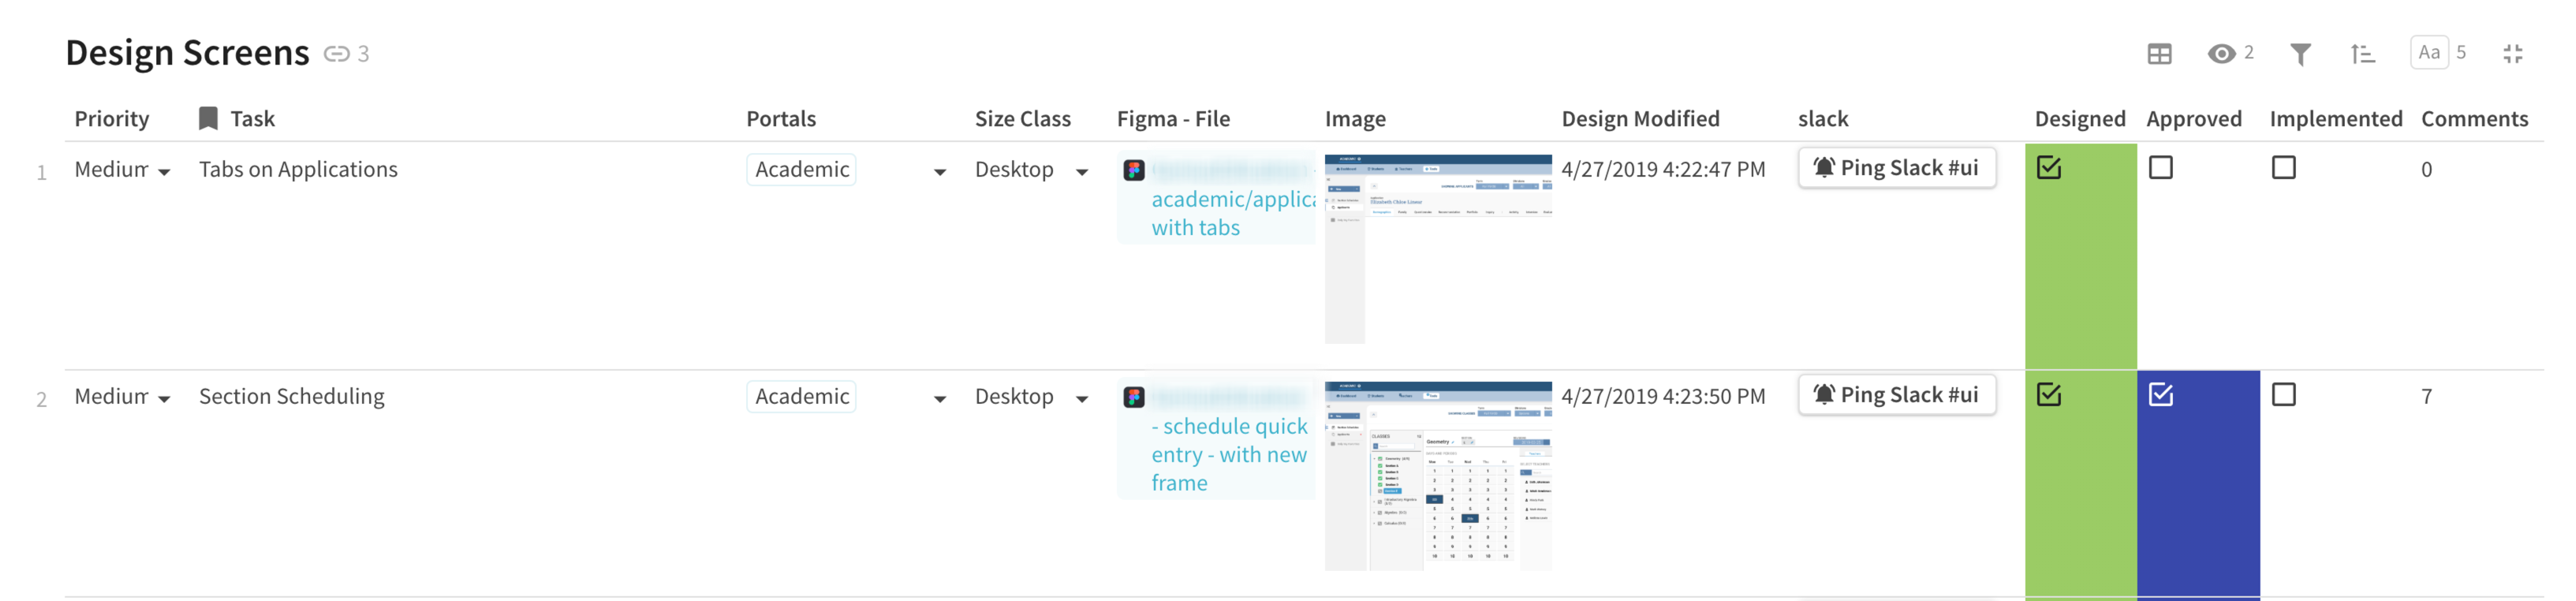
The Figma integration (Coda calls it’s integrations “packs”) also pulls in the last modified date of the frame as well as the number of comments on it in Figma. The other data checkboxes and dropdowns are all completely customizable for your purposes inside of the Coda table.
It’s possible to embed static designs from Sketch of course, but it’s not as full featured. Perhaps Sketch will be releasing web-facing APIs later this year.
There is another useful integration you might notice: that button in the screenshot that says “Ping Slack.” It will send a pre-formatted message to a specified channel with the relevant details about this design task. The button is disabled until a user marks the row as “Designed”.
Coda also has good integrations with Github, so if your development team is creating issues or Pull Requests that correlate with the design tasks, then those can be added as special links here as well, with columns that show summary data about the status of the issue or PR pulled from the the Github API.
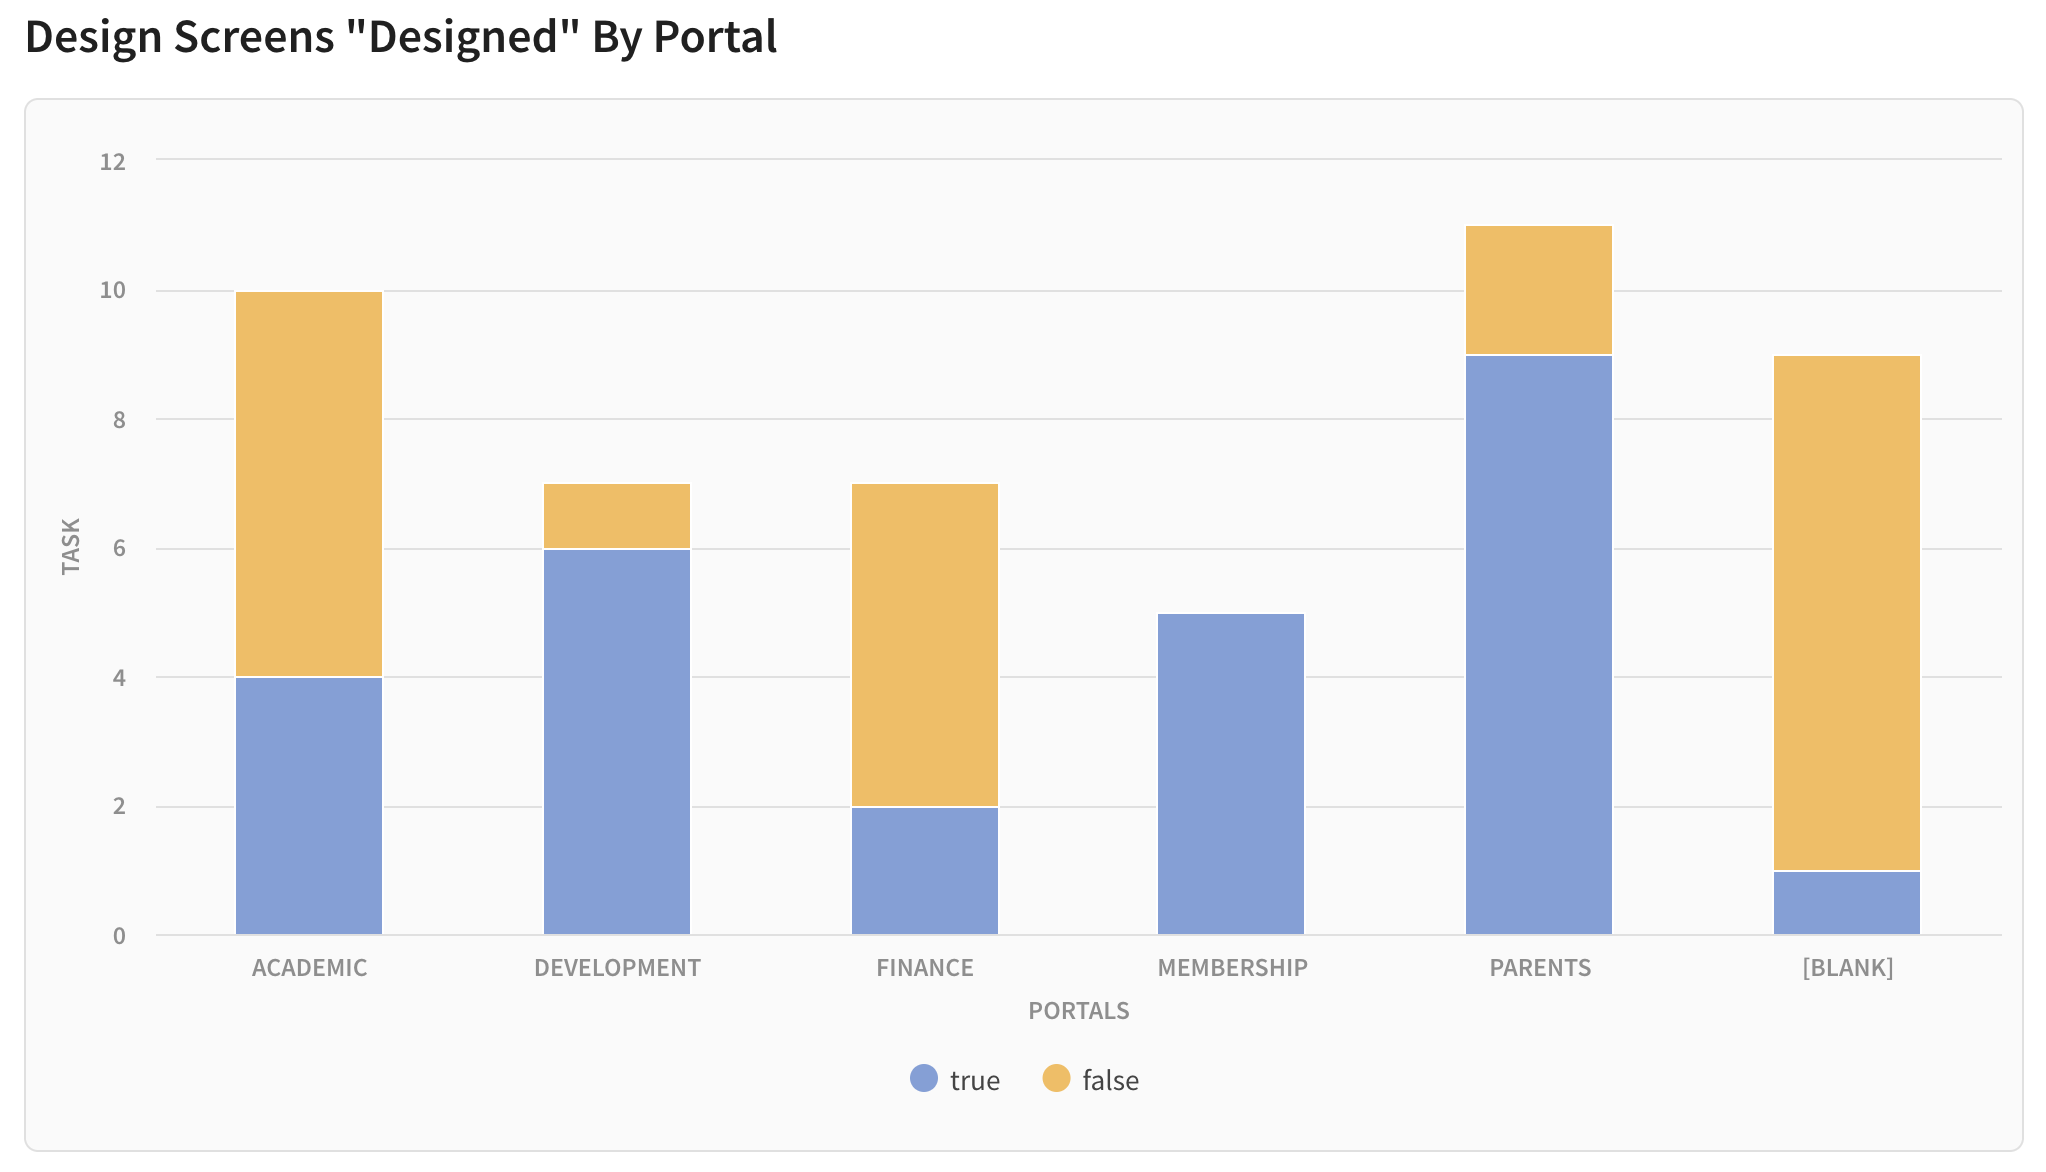
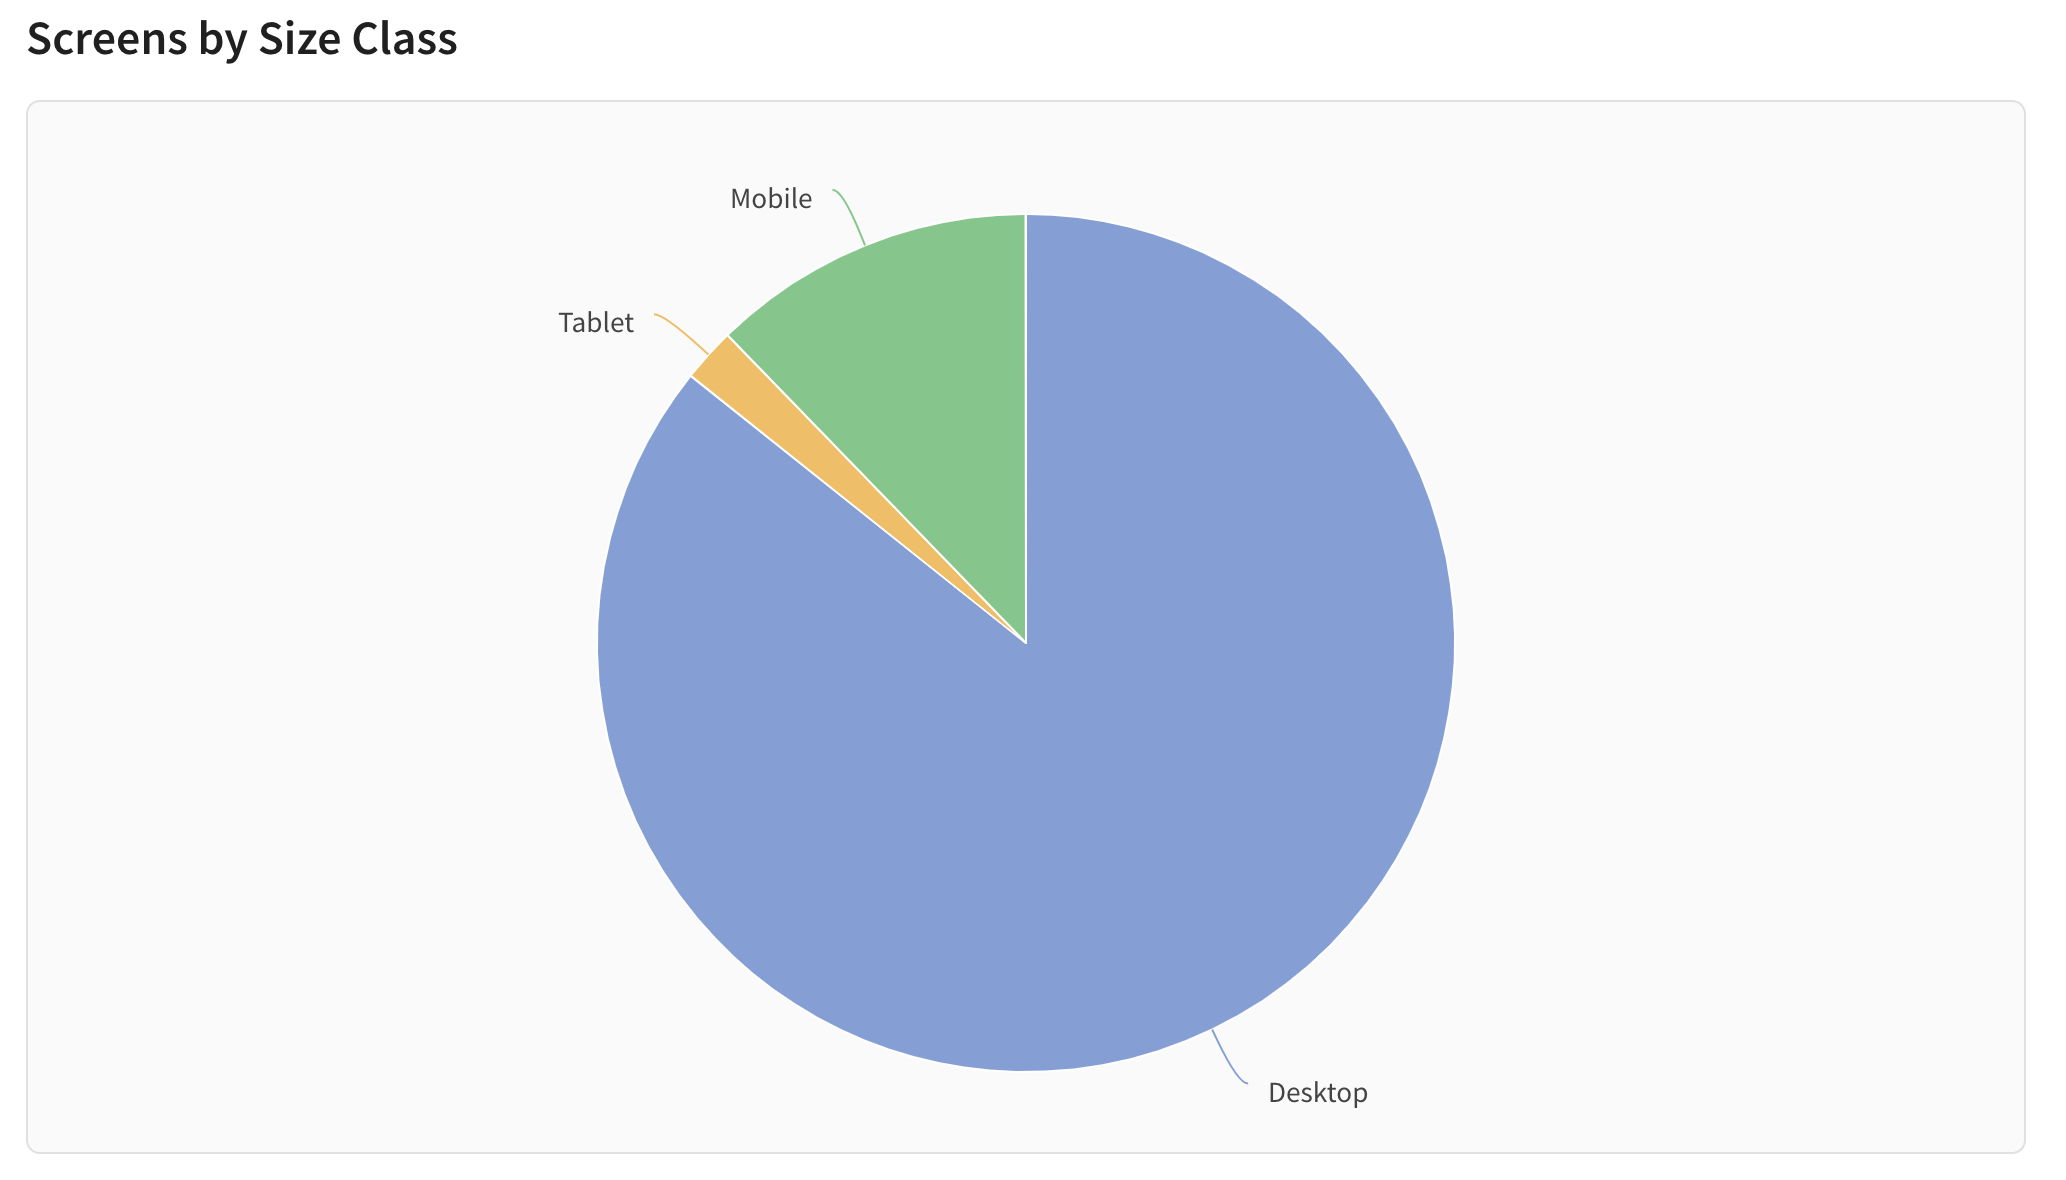
Each table in Coda is not isolated, it can be referenced from other tables, viewed in multiple different charts, and displayed in many formatted or grouped views of the same data. Each cell or row can have conditional formatting and you will find many of the same types of formulas you would in Excel.
The addition of the integrations with Slack, Figma and Github mean that you can finally bring things all together in one place. Figma bills itself as “the app other people use to build their own apps”. This seems true to me, it’s perfect for creating your own custom project management tool, research data tool, documentation tool, feedback gathering tool, and process collaboration tool. Each of these is possible if you just dig in and start building or look at their examples. If you’ve found yourself wishing that excel or google sheets could do more, this is for you.
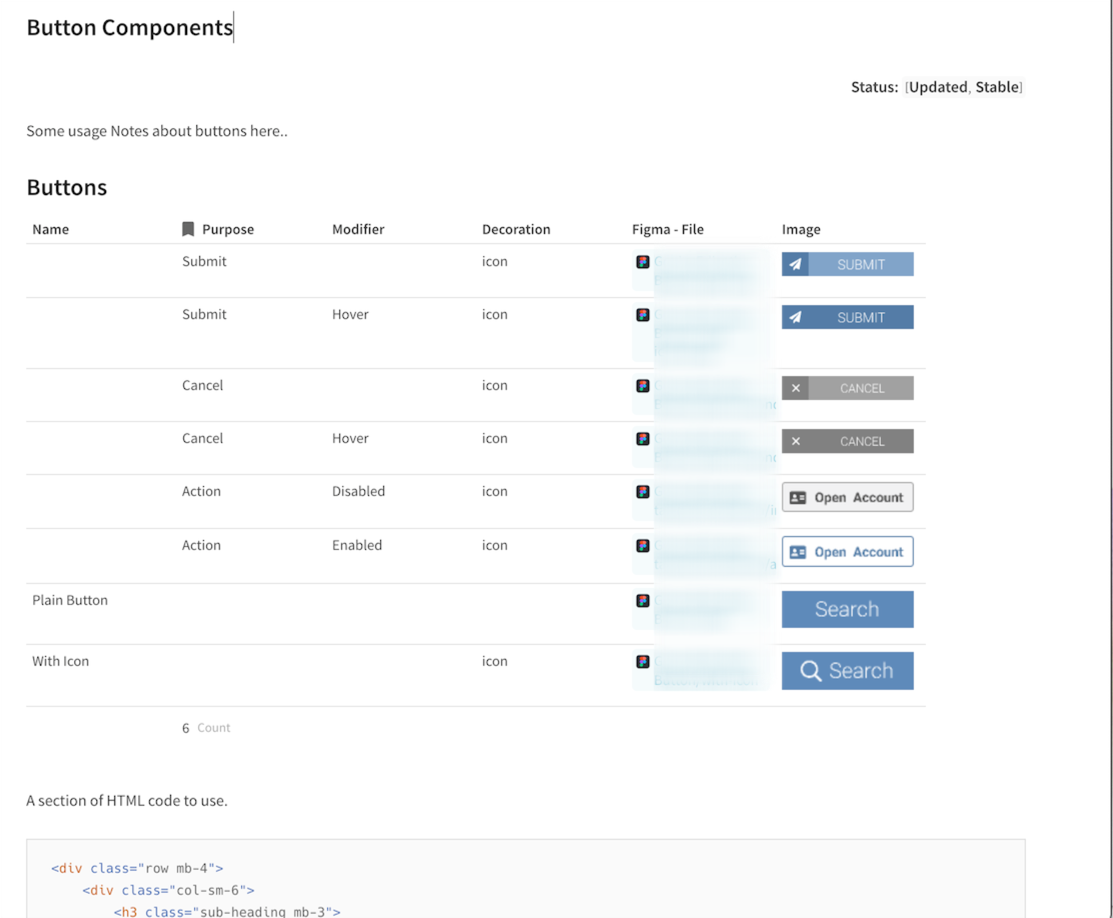
The next part of a design system creation process is tracking the implementation by frontend developers in various platforms. Creating a table that summarizes all of the components you created in Figma is easy.
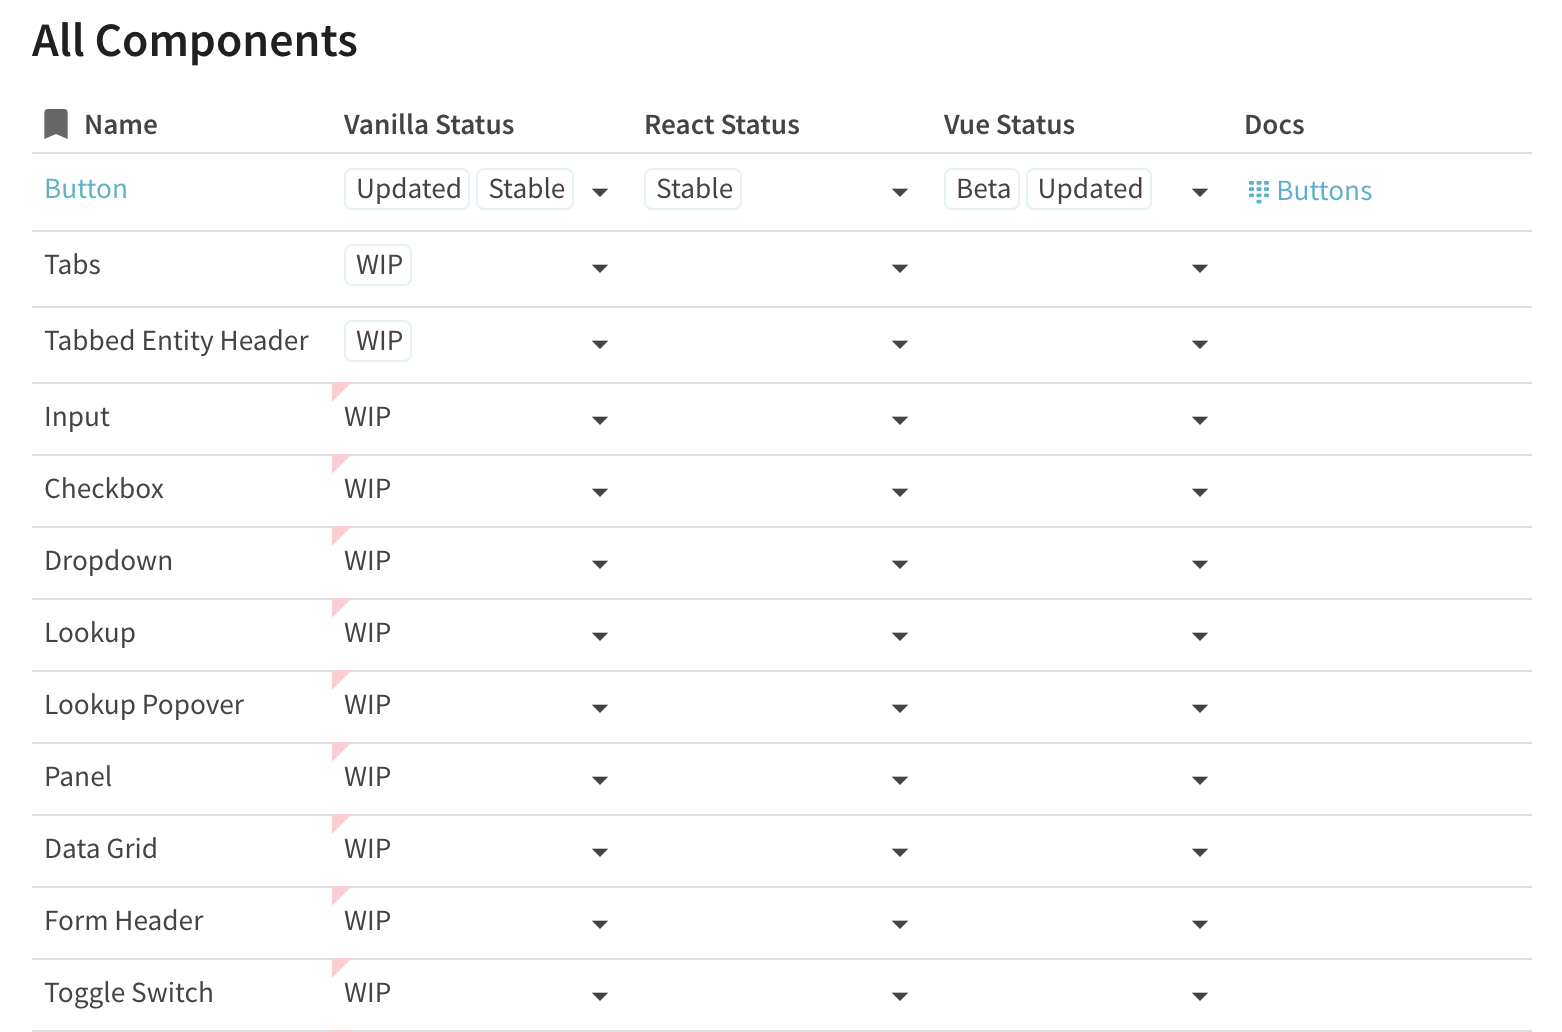
Then you can create a detailed page documenting the design and implementation details of each component, and link to it from the main table.
On this detailed screen you can embed long Gists of HTML, links to Github commits for the SCSS, Figma frames, or embed the Wireframes from Miro, or maybe add an example animation in a video. You could even link to the UX research tasks and survey results that you’ve gathered in other tables of the document. And, of course, it’s easy for anyone on the team to update this document. They don’t have to open a markdown file and learn git to commit it to a repo.
I see people asking about the limitations and advantages of various hosted design systems tools all the time, ZeroHeight, Invision, Zeplin, Abstract, etc. I think those tools are really interesting, but ultimately can’t stretch to fit every usage scenario. It’s possible what you really want is something more free-from, less prescriptive - something more collaborative for the whole company to own and use. I think it’s worth trying to put your design system in Coda… for my clients at Systematic UI, I’m already trying it out.